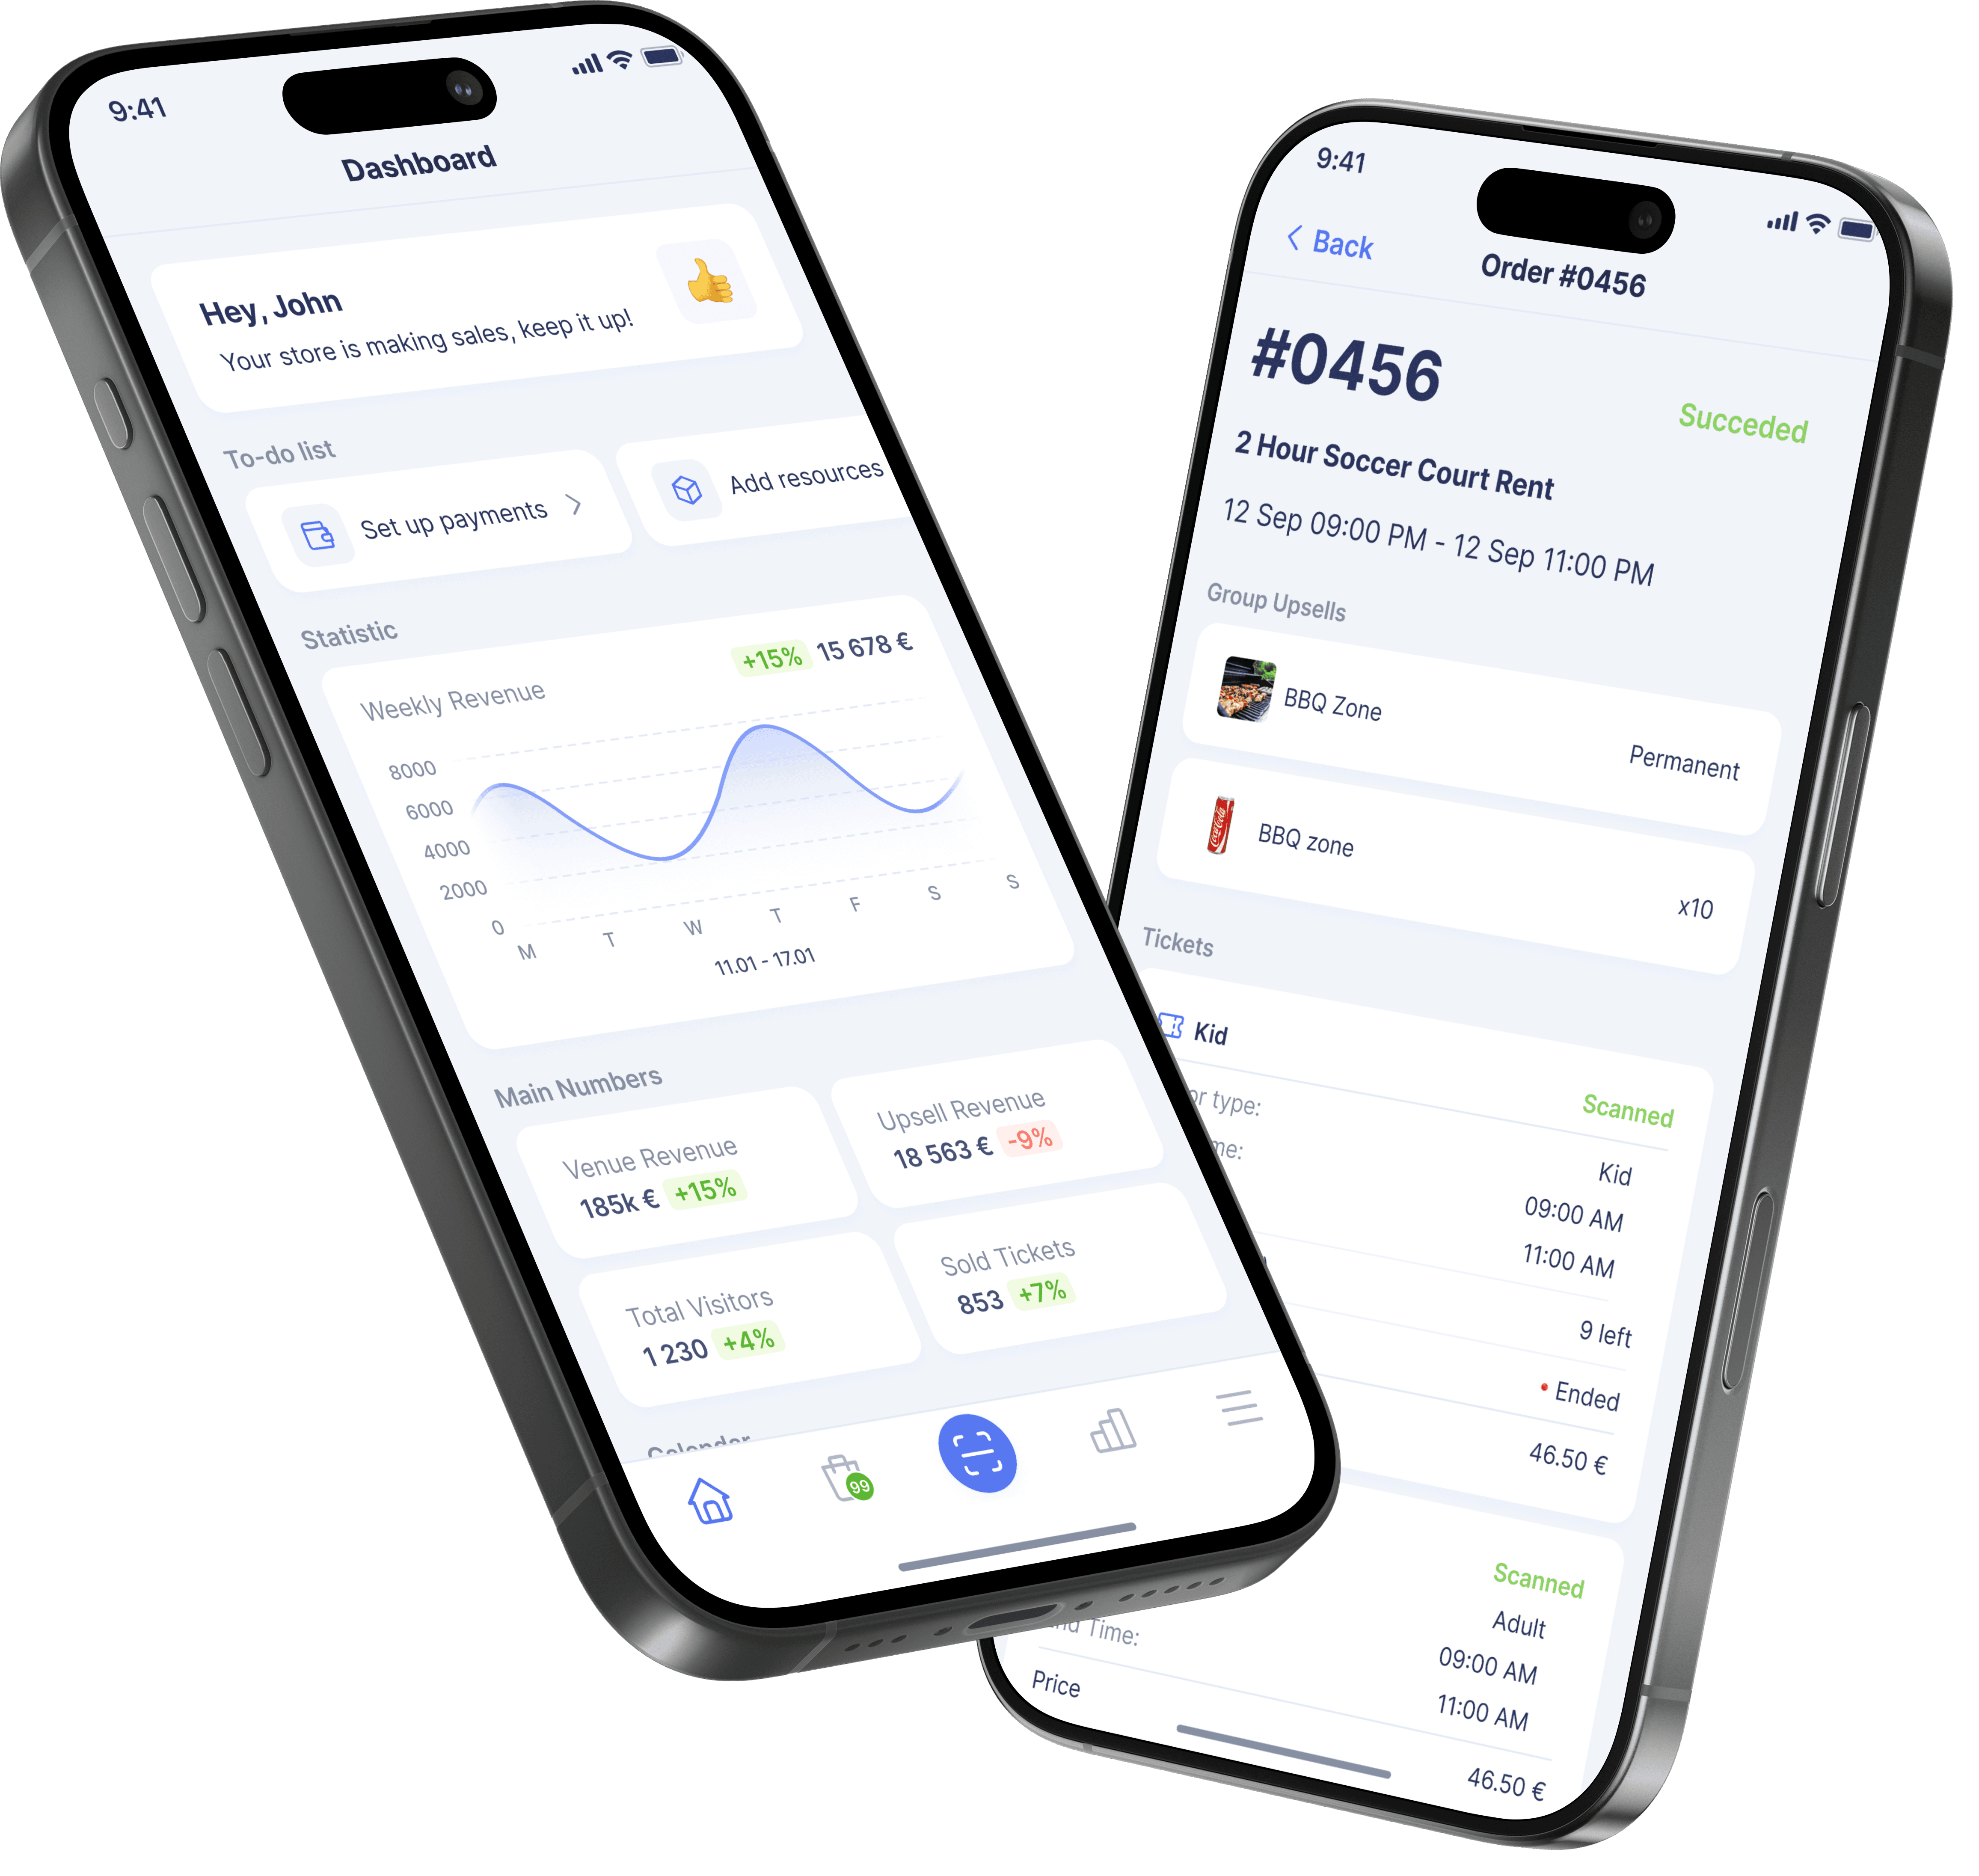
StockViz
StockWiz is a robust stock market analytics web platform that transforms complex financial metrics into intuitive visual tools for data-driven investment decisions.
Role & Technical Challenge
In this project, I focused on designing an interface capable of efficiently processing vast amounts of financial data. The primary challenge was to build a system where users can quickly interpret market dynamics without being overwhelmed by numbers.
Deep Financial Analytics
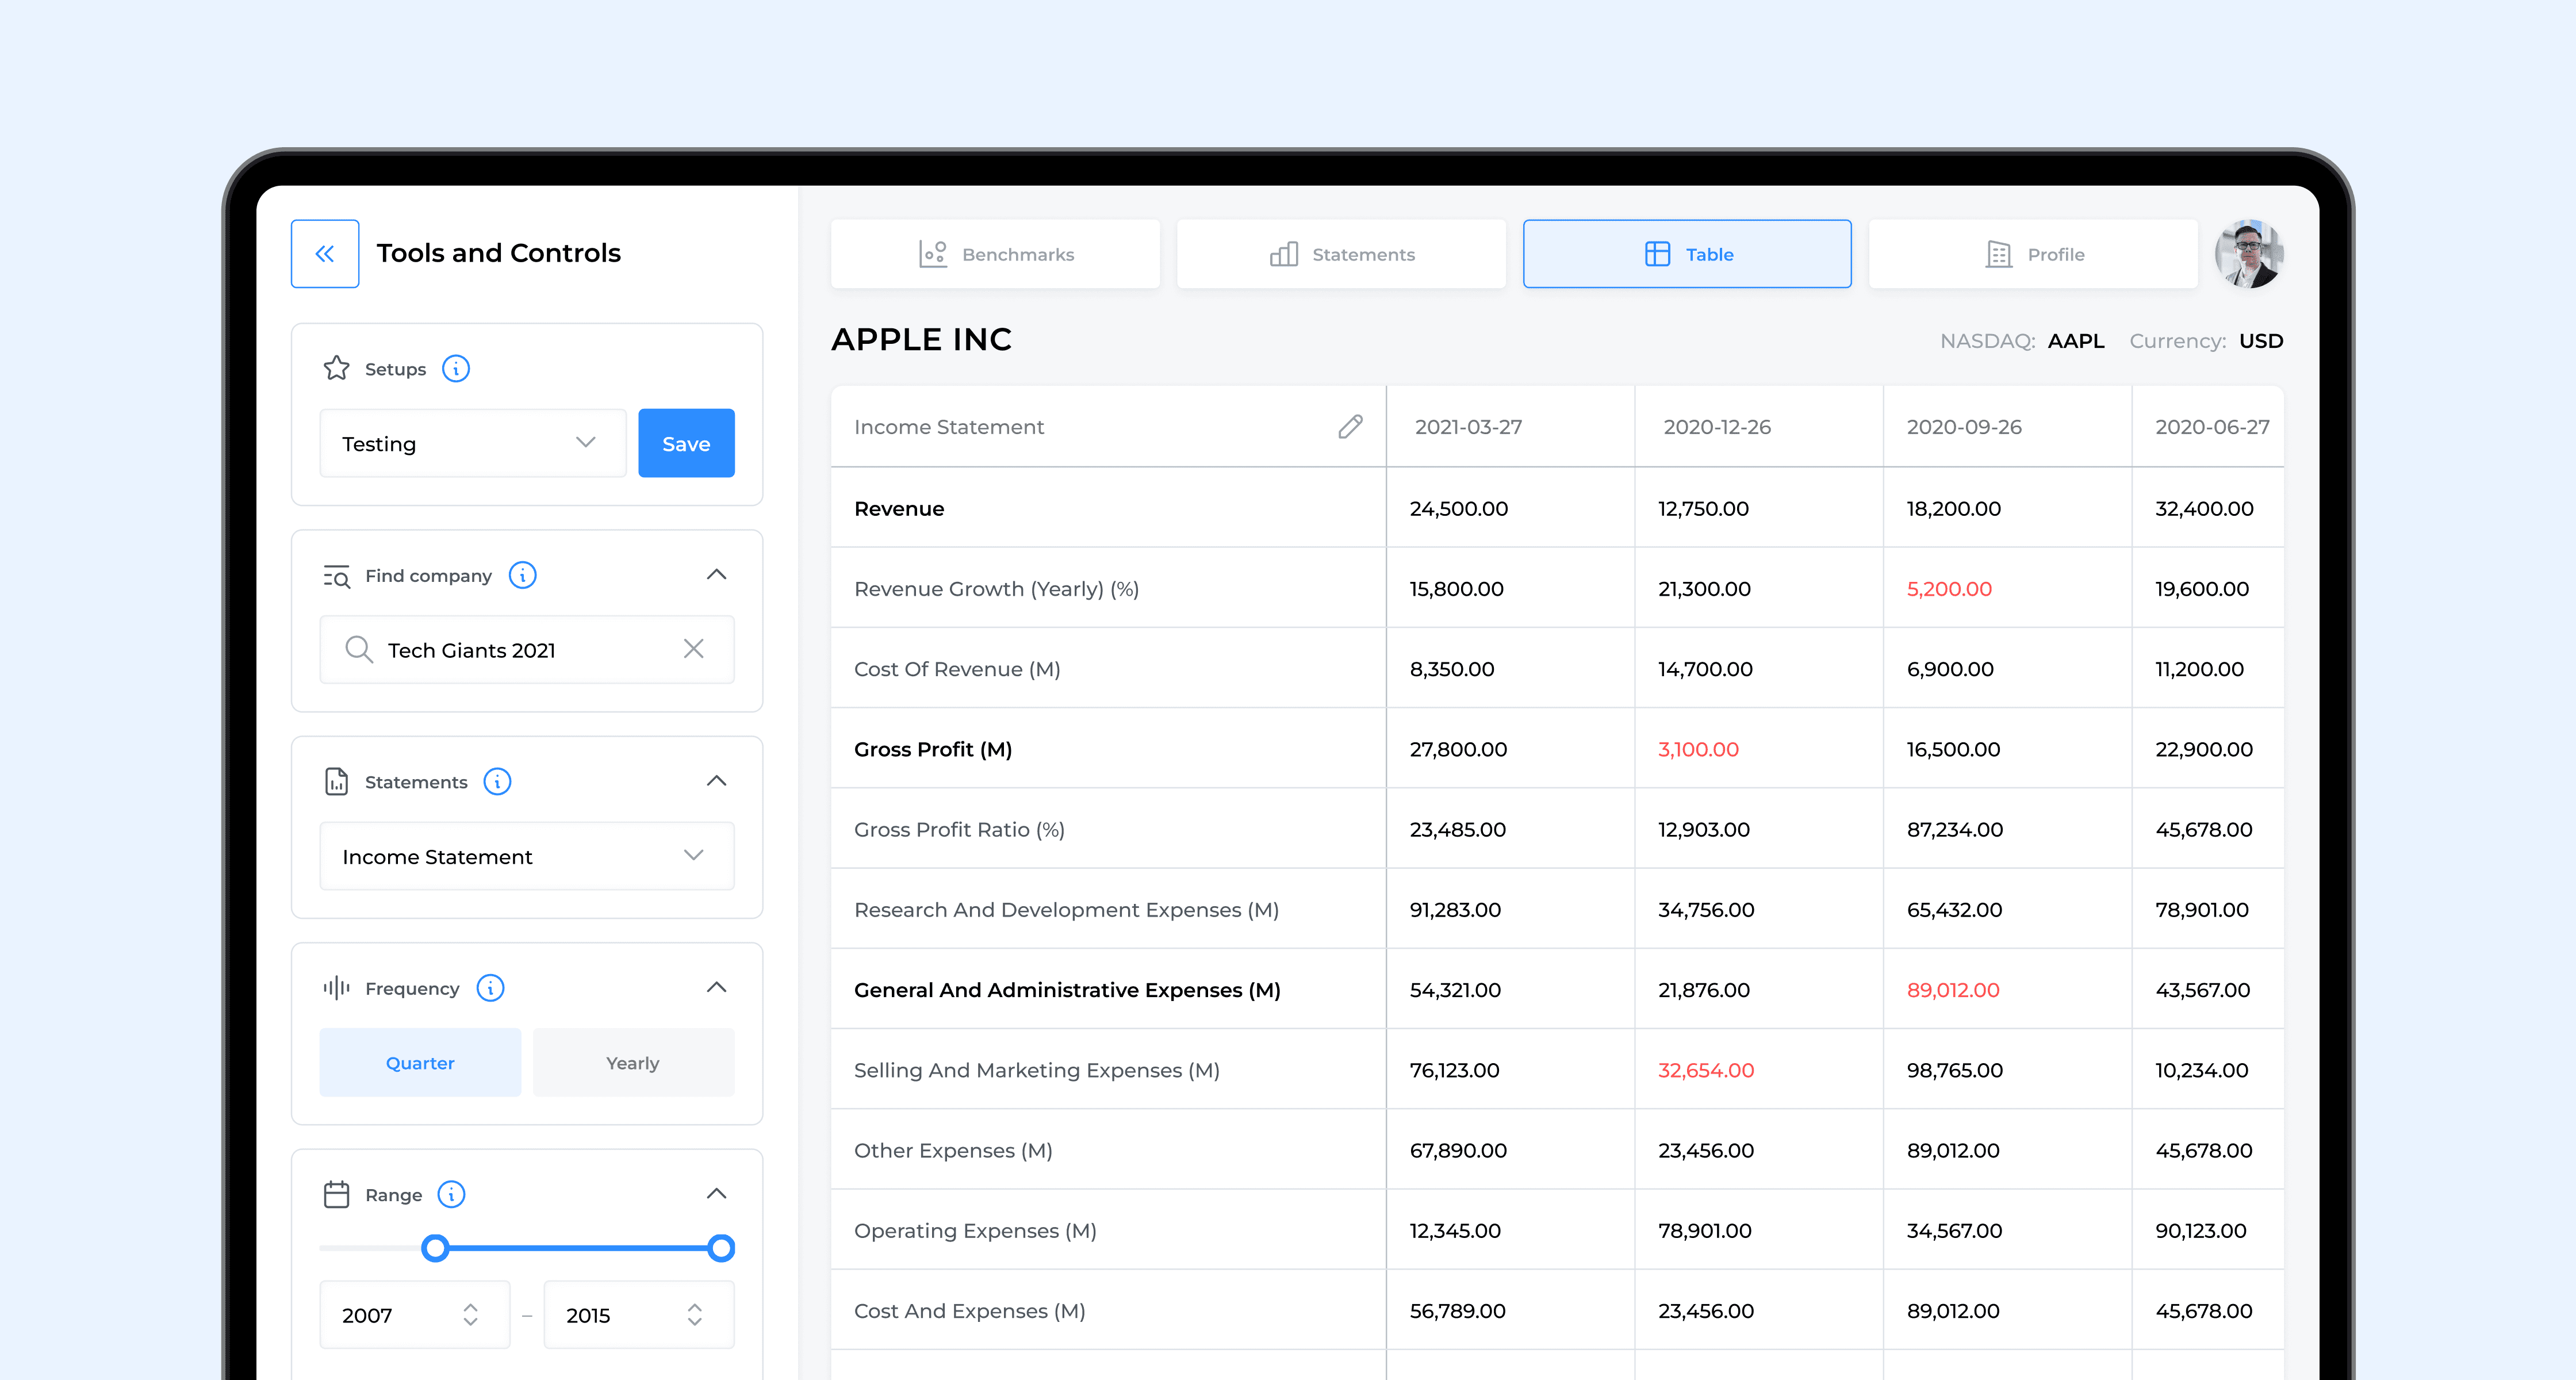
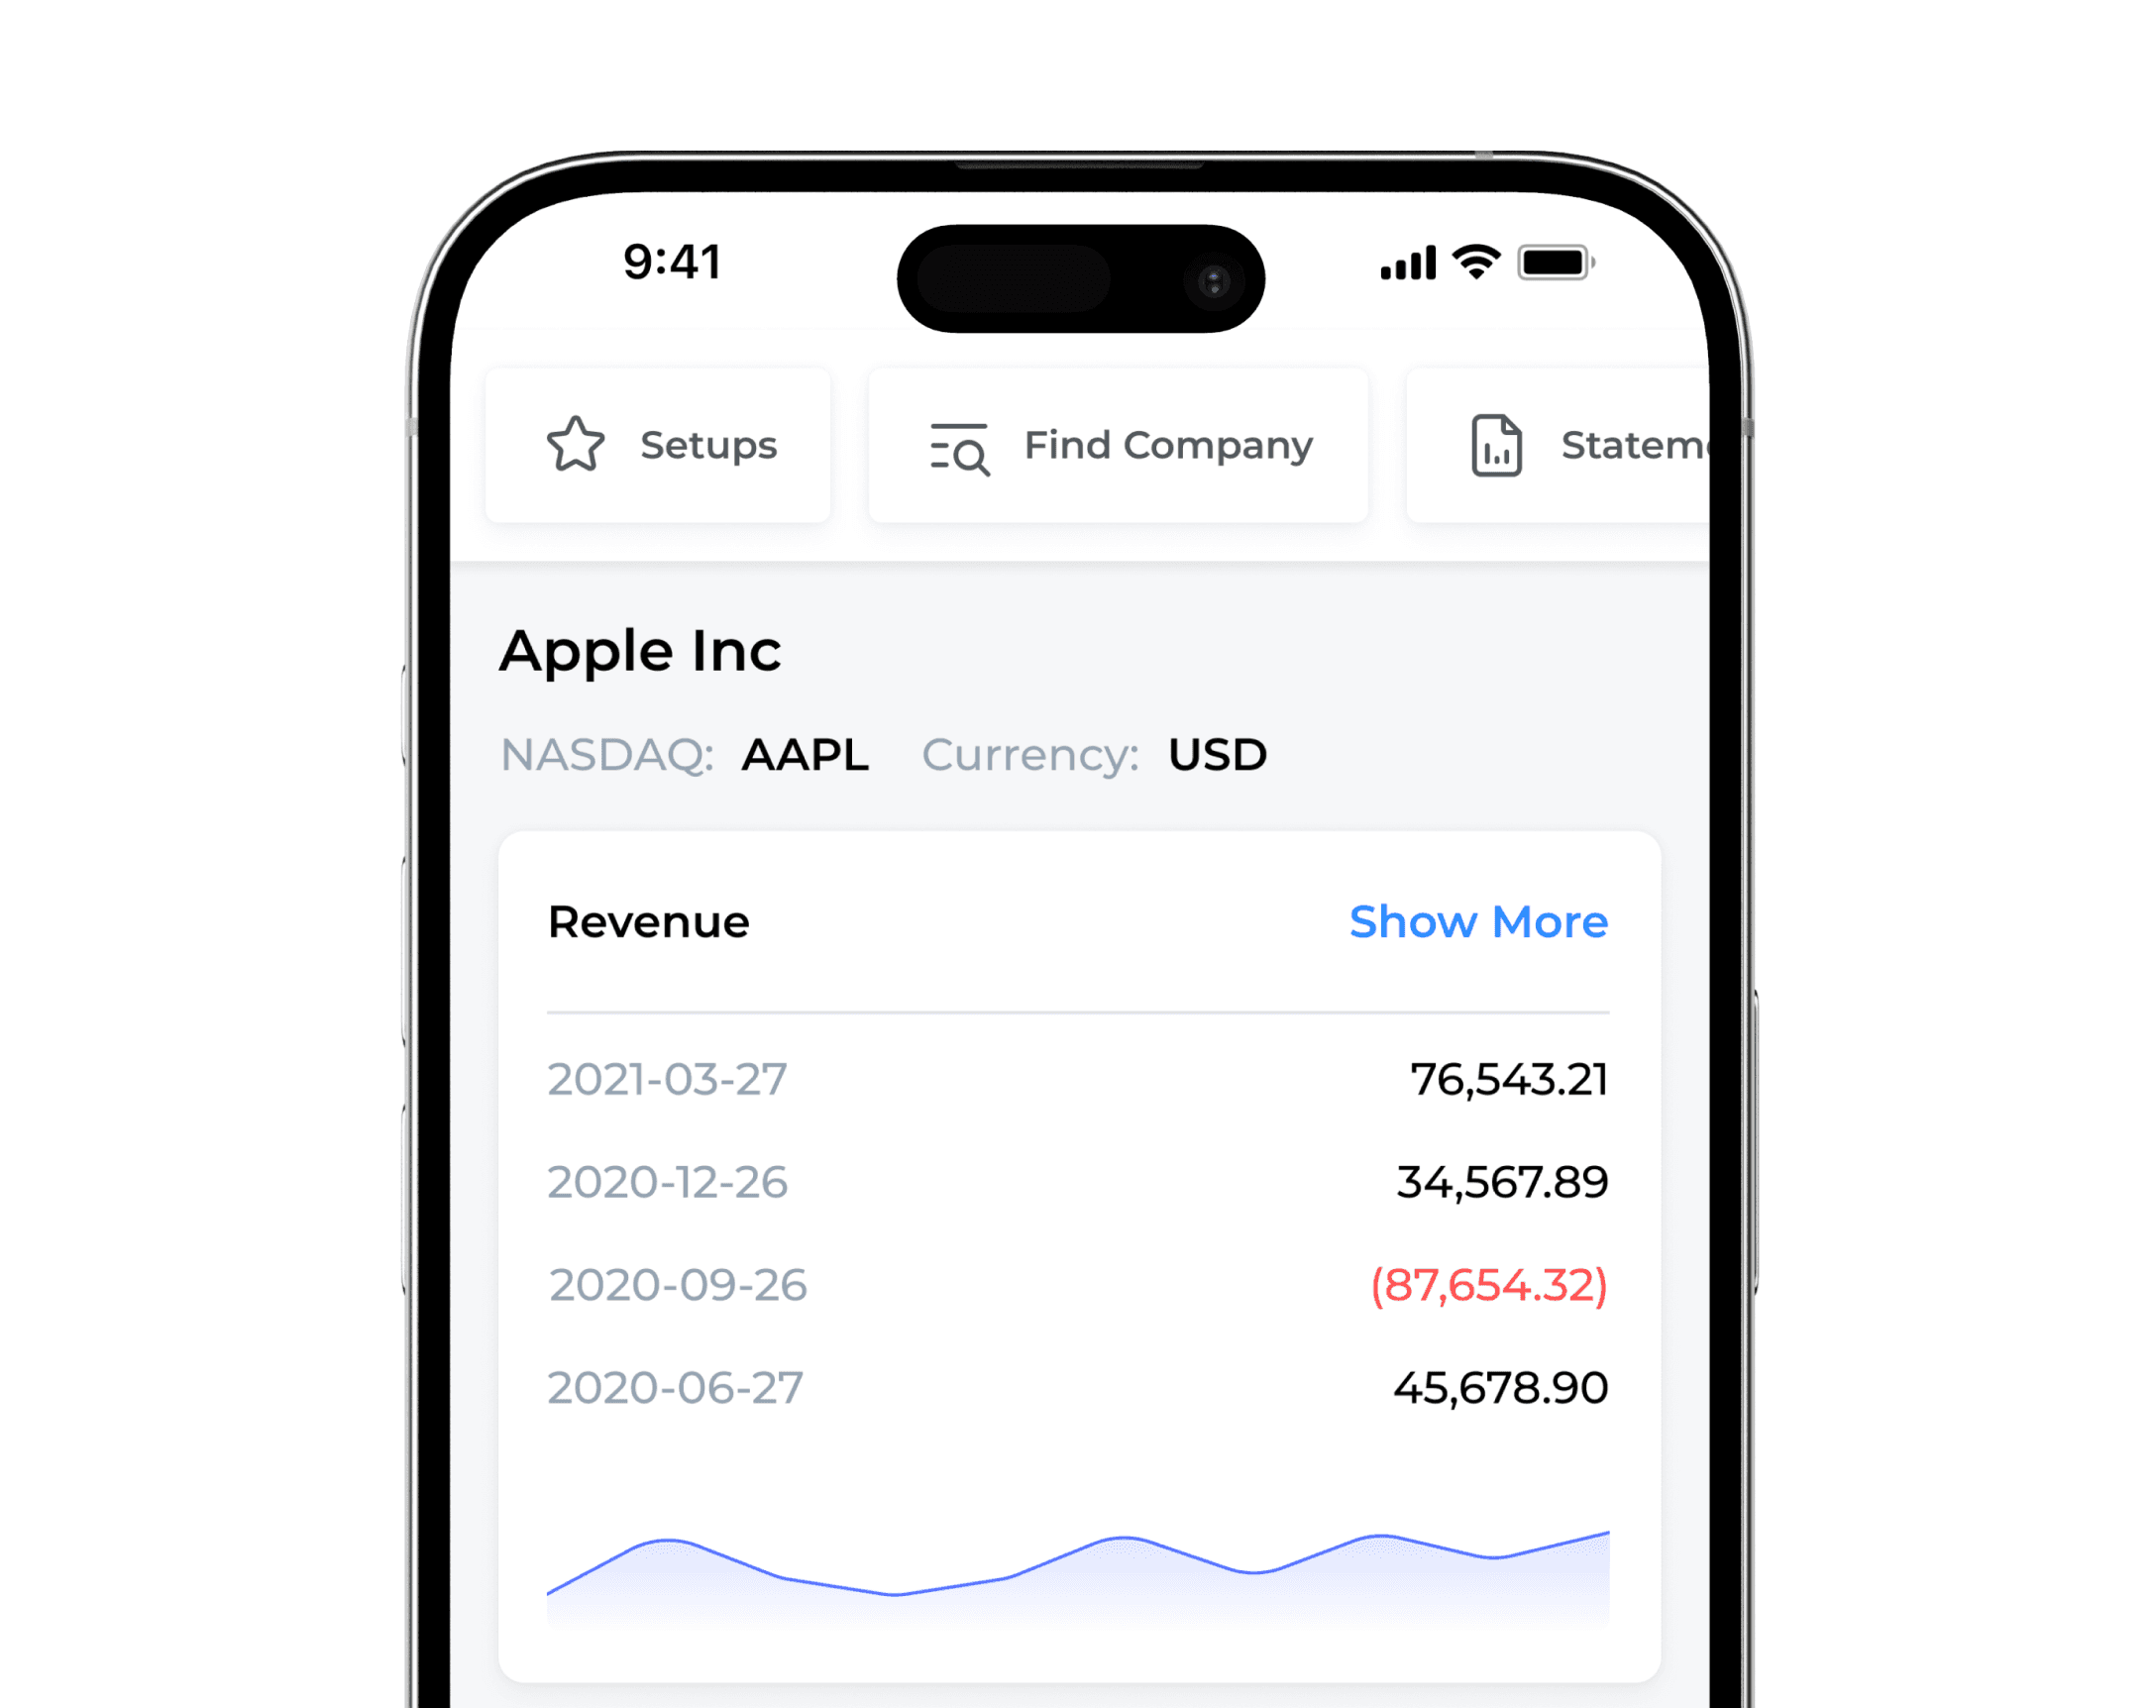
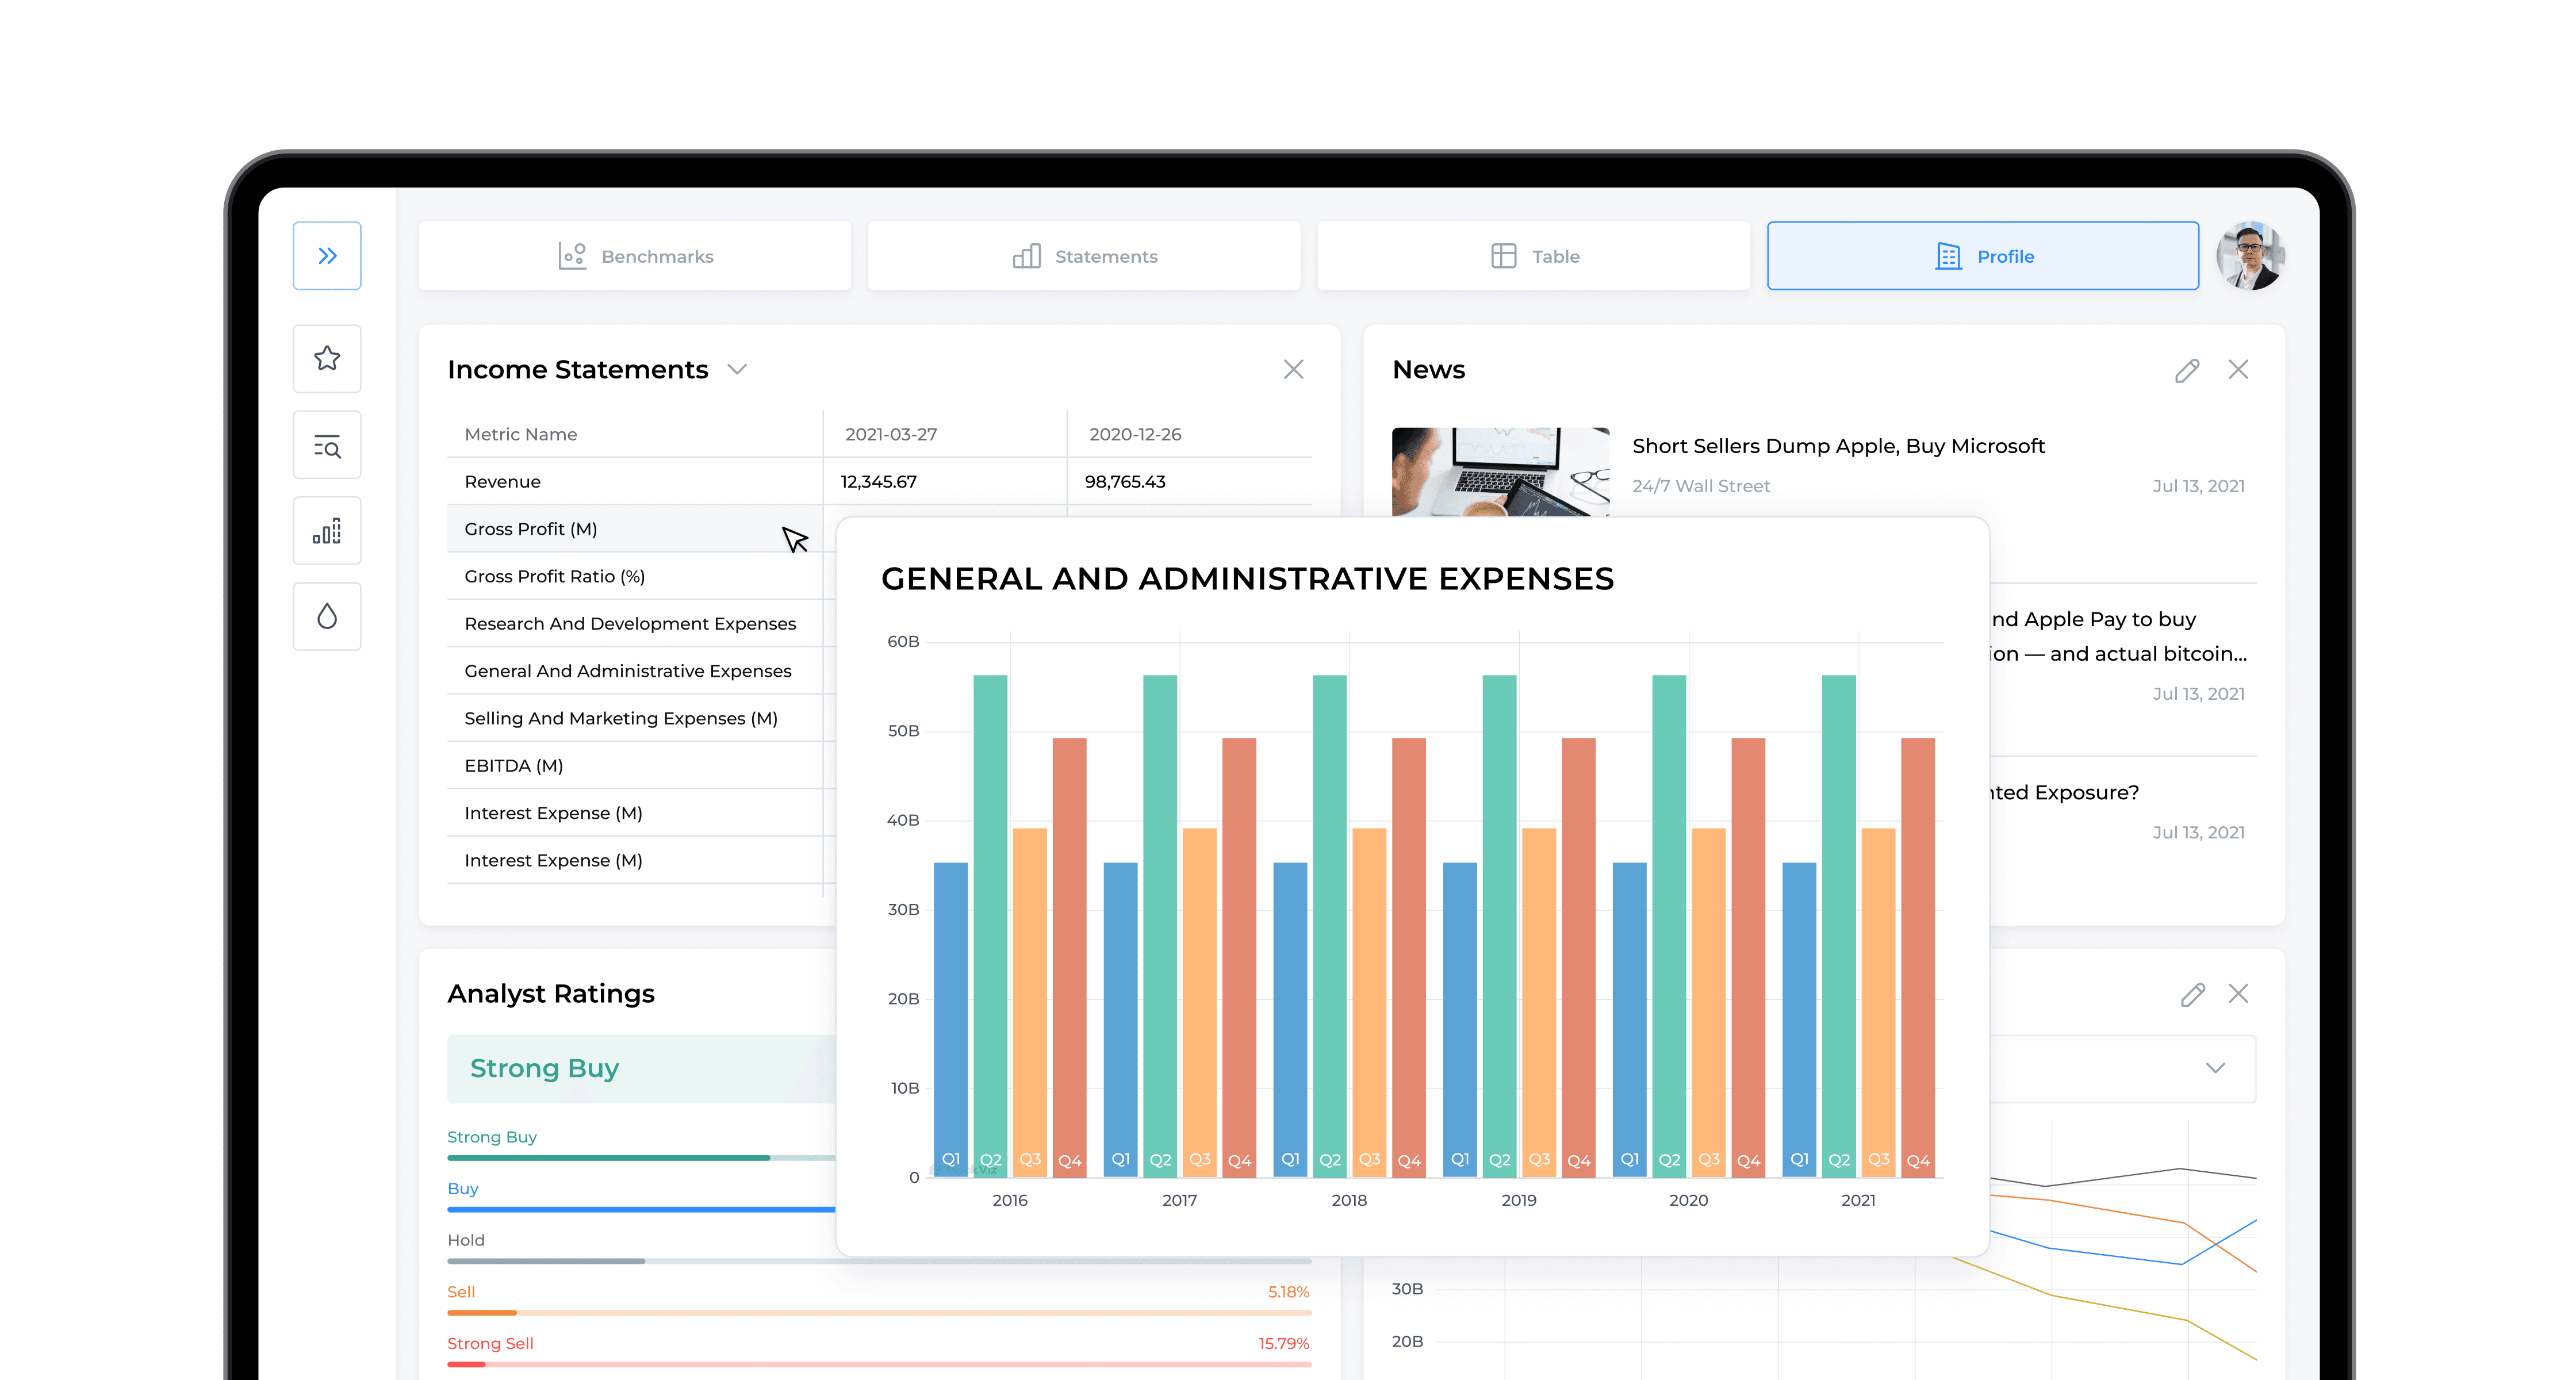
The platform provides access to key company metrics, including Revenue, Gross Profit, EBITDA, and Interest Expense. I developed a structure that enables users to easily compare these figures, track them over time, and understand the true financial health of a business.
Advanced Data Visualization
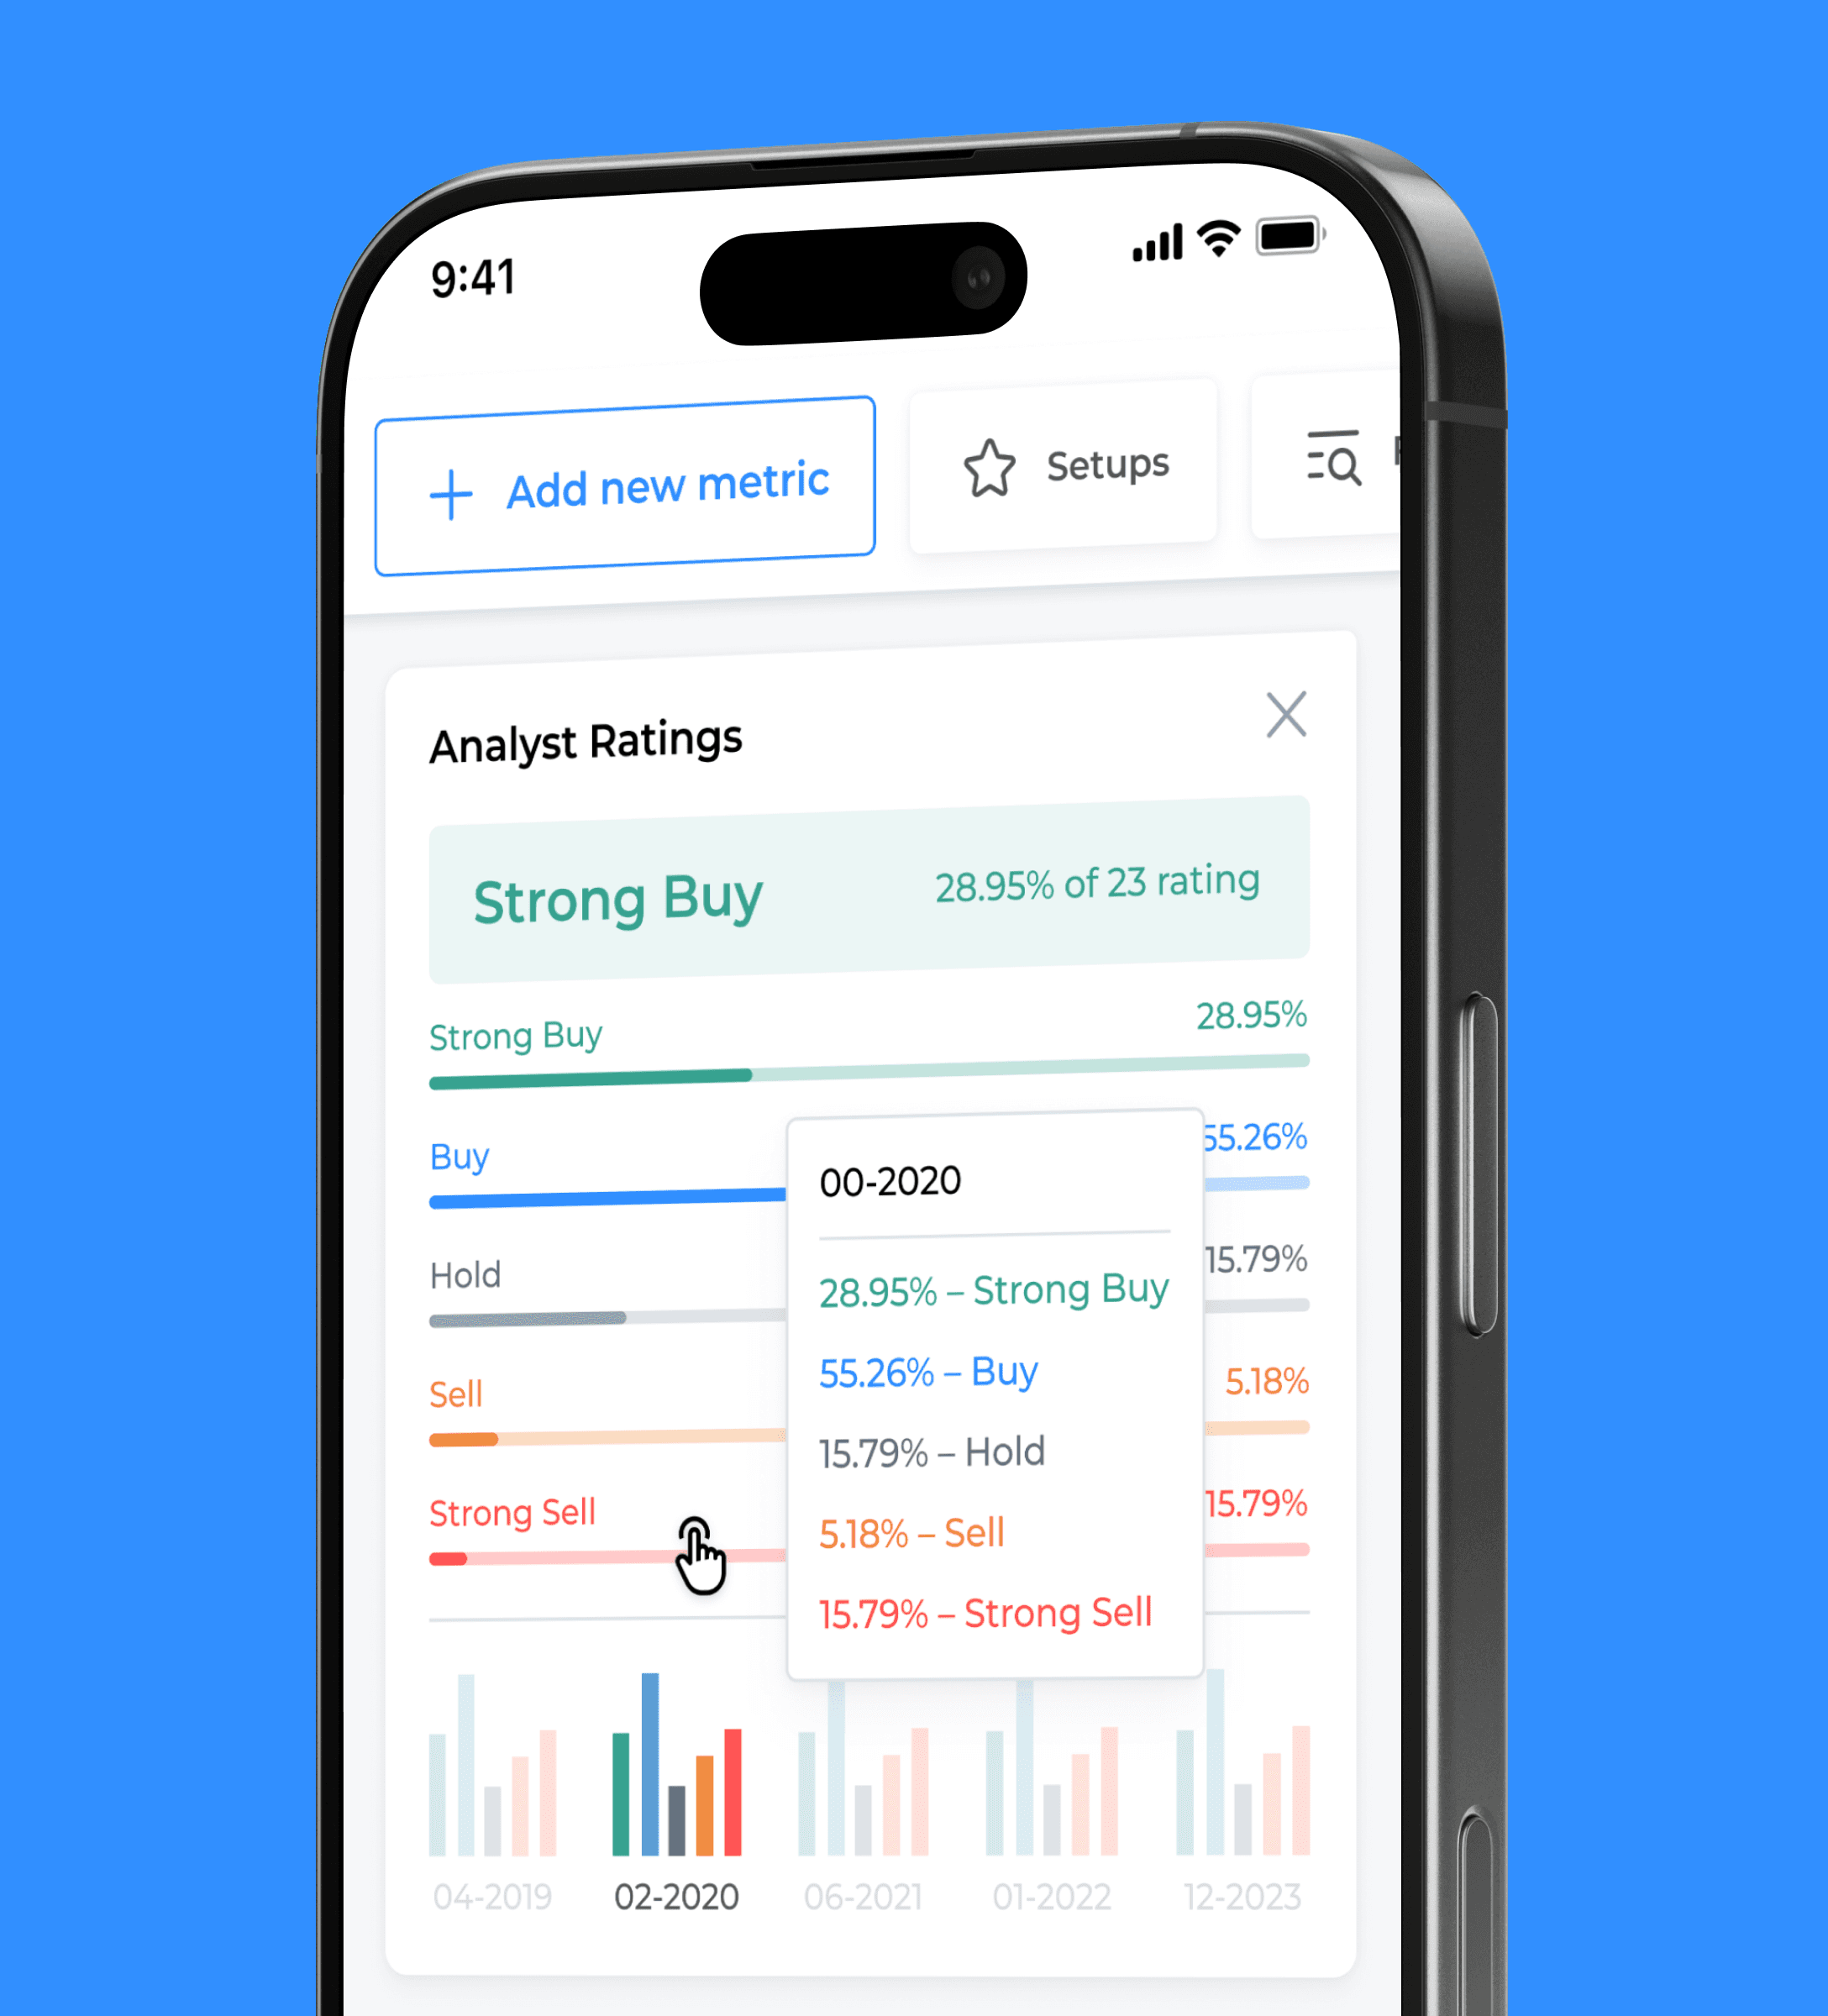
Working on StockWiz involved designing various chart types and diagrams. Each visualization was tailored to a specific data type to ensure maximum accuracy—from linear trend lines to complex asset distribution histograms.
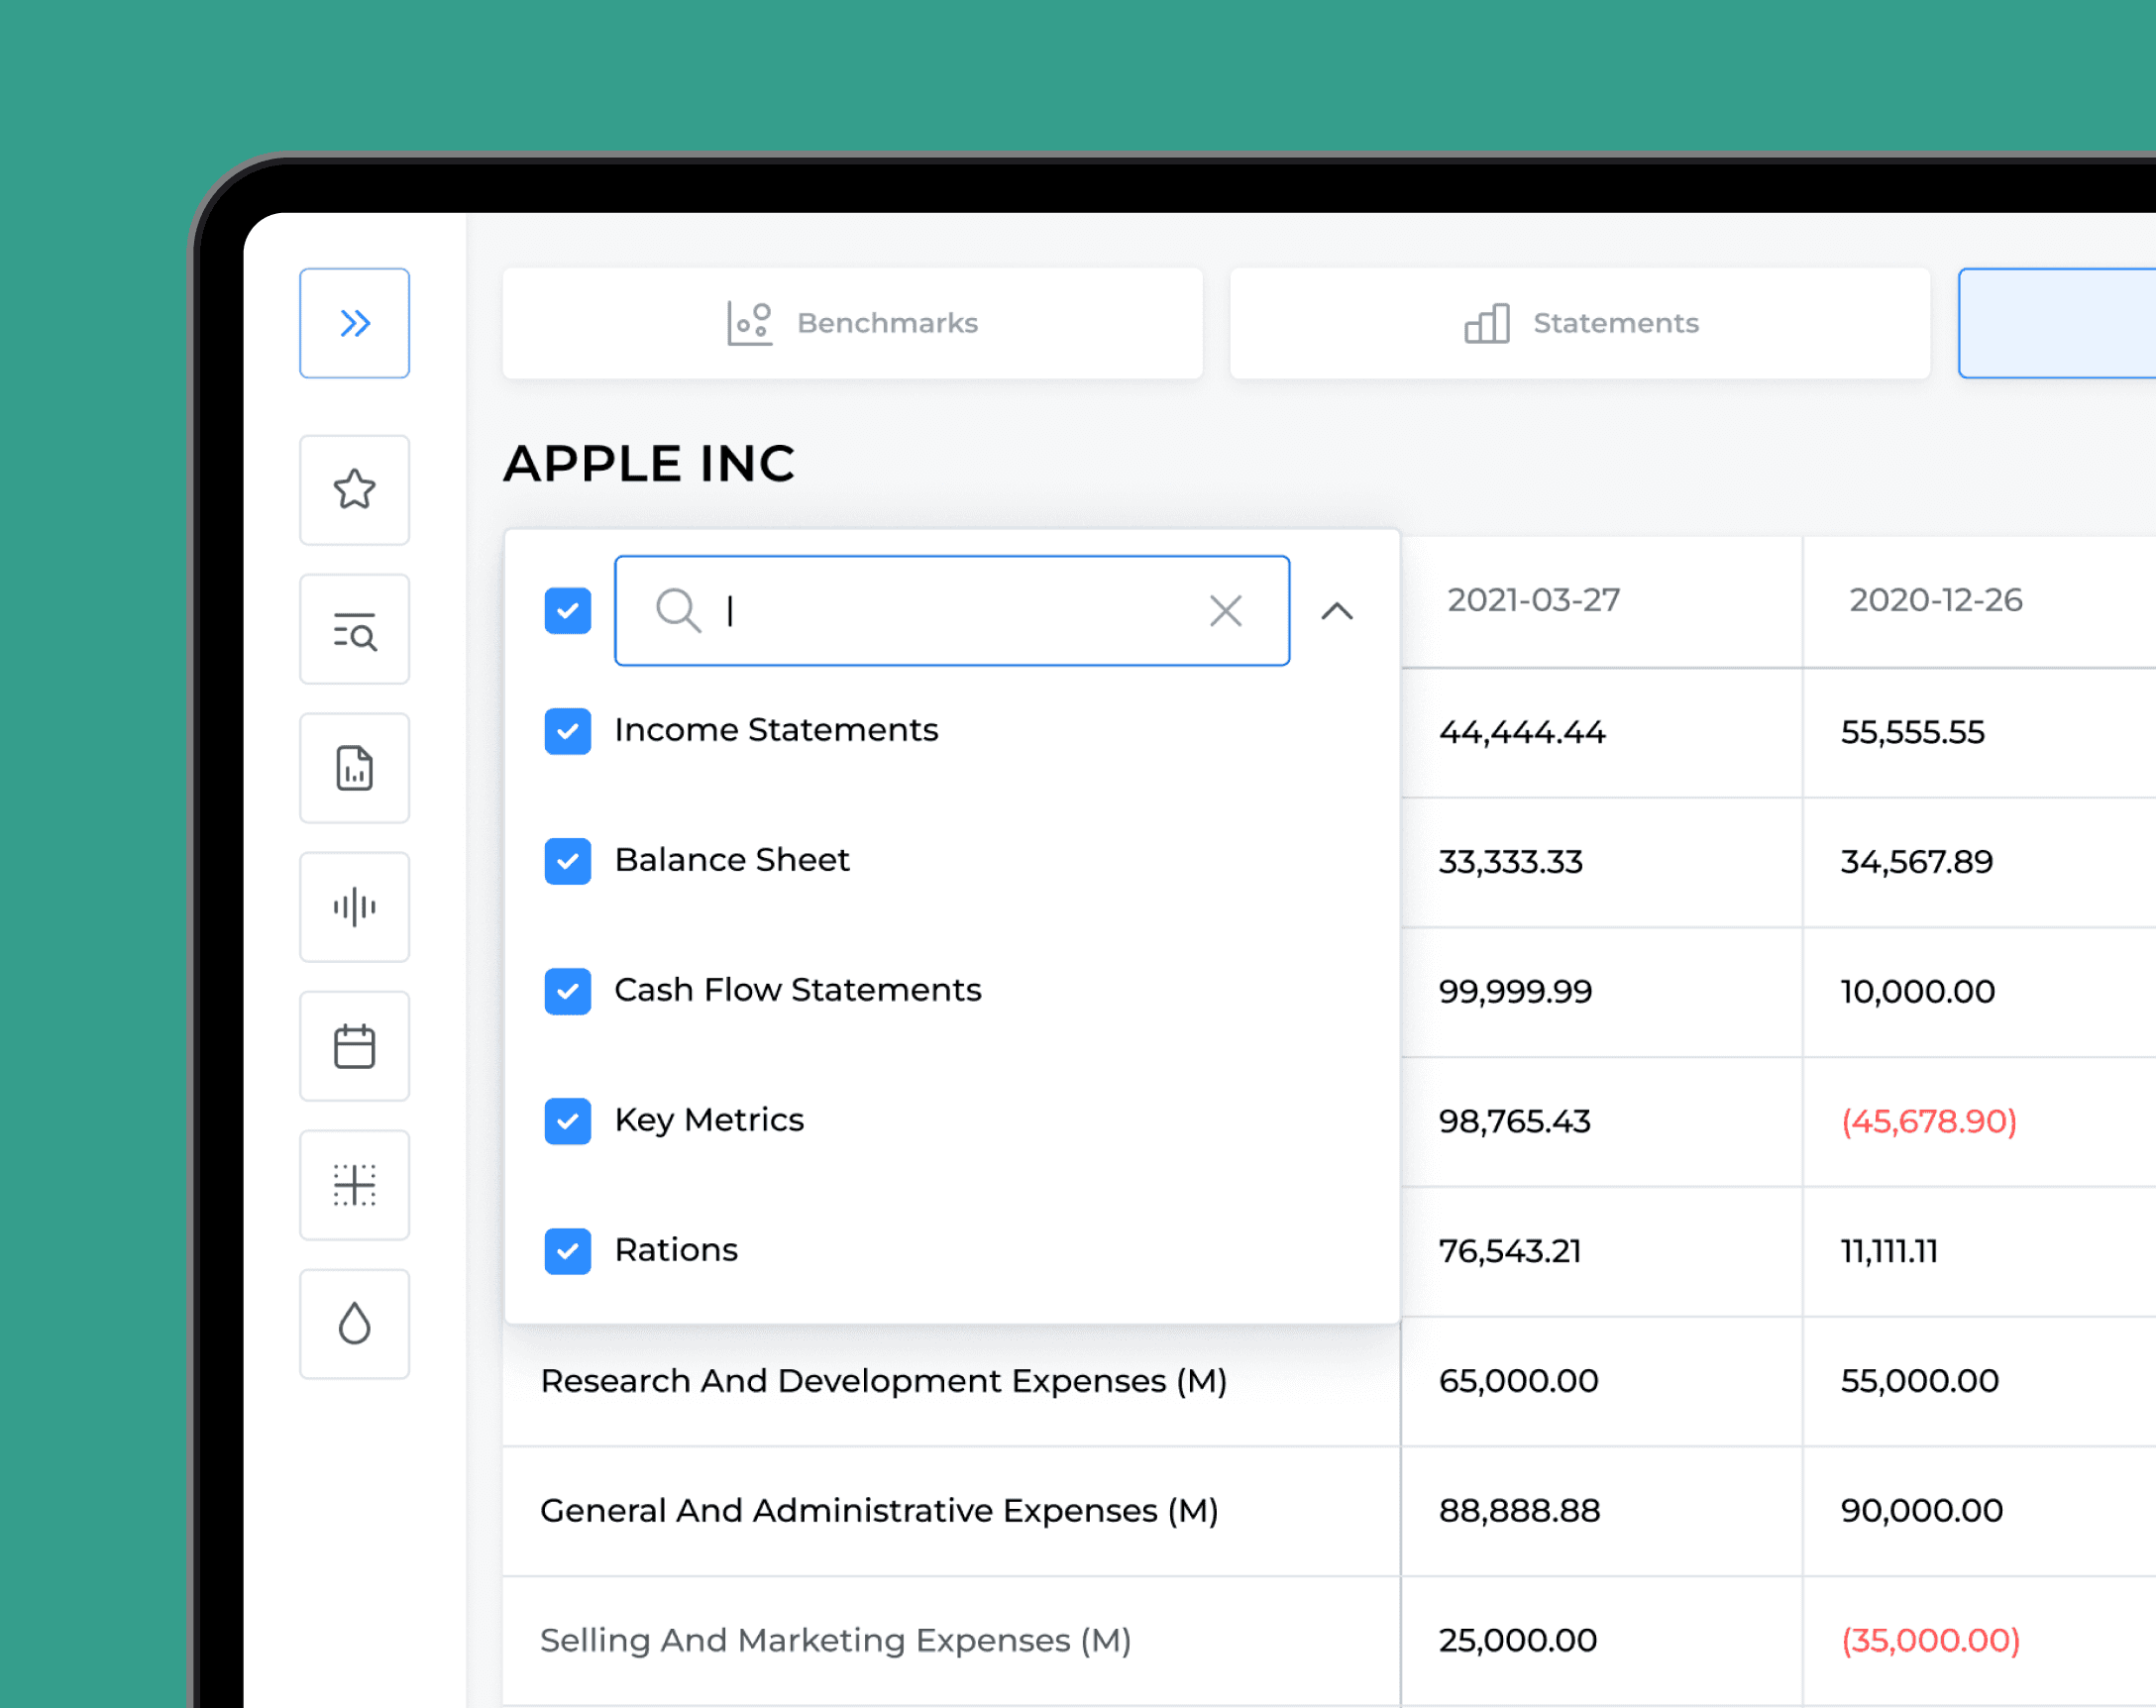
Customization & Flexible Views
A significant focus was placed on creating a truly interactive experience. Users don't just view charts; they engage with them in real-time—scaling timeframes, overlaying multiple metrics to uncover hidden correlations, and performing instant drill-downs into specific data segments. This transforms static report viewing into an immersive and intuitive process of market discovery.

Market Context Integration
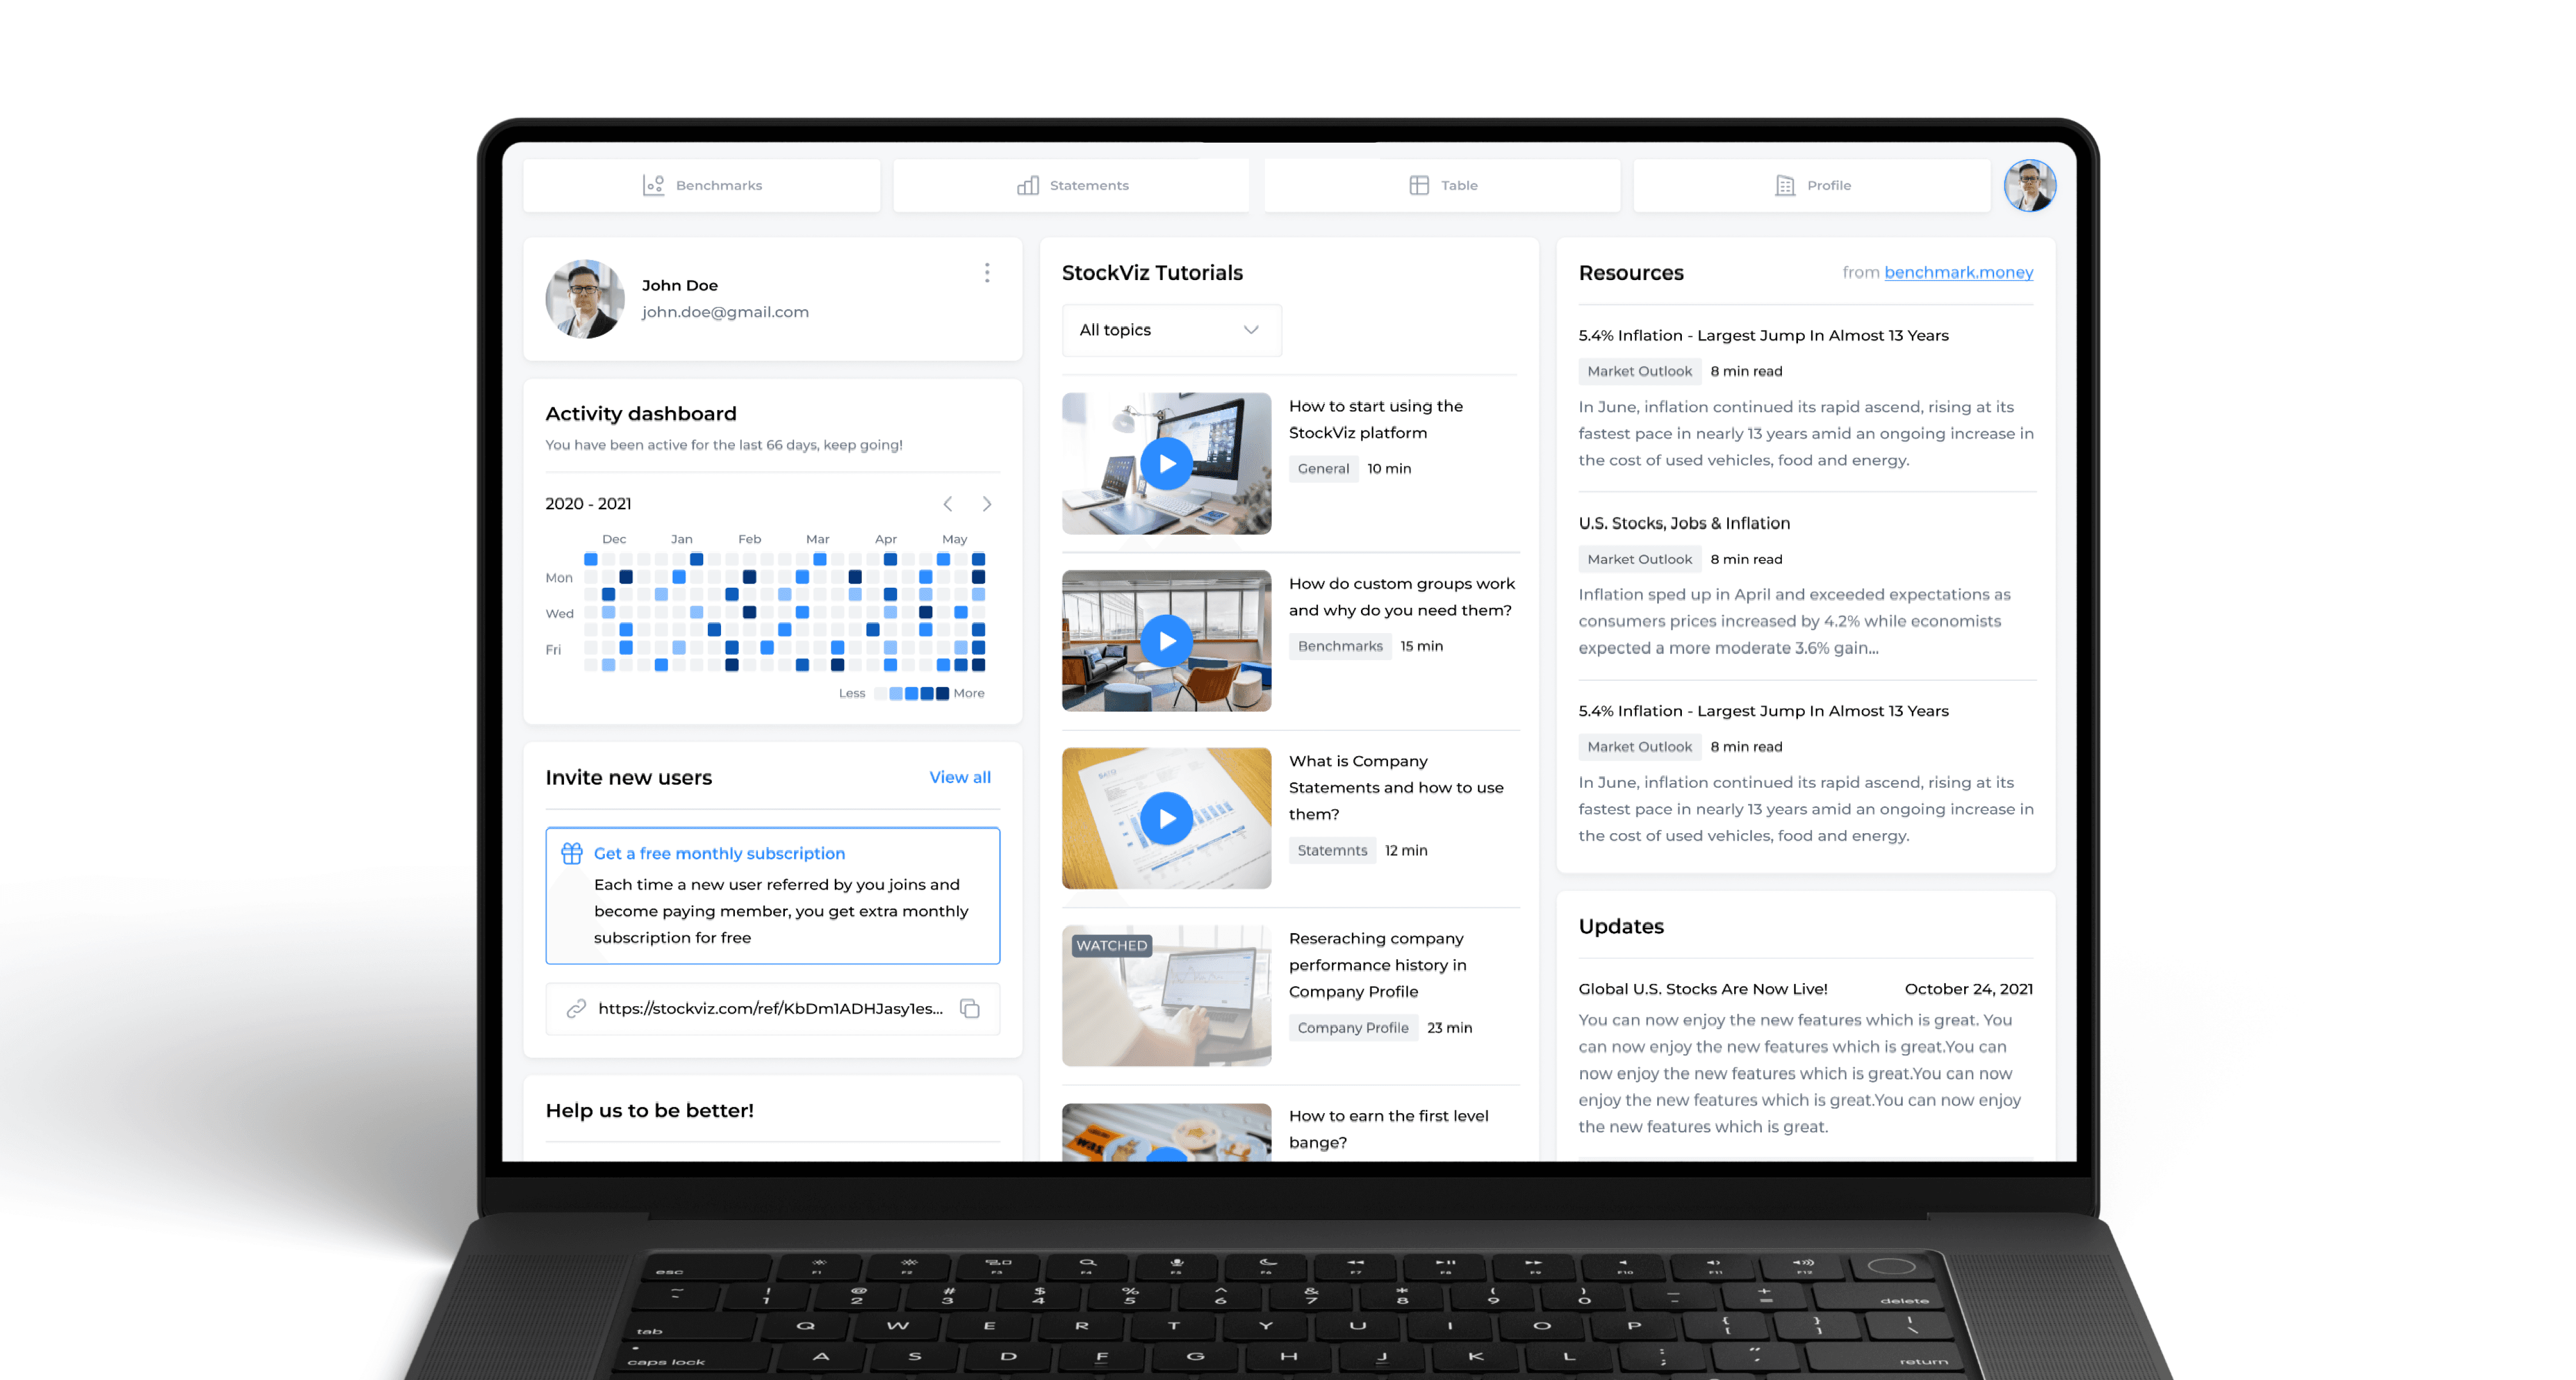
To provide a complete picture, a real-time news feed is integrated into the interface. This allows users to see beyond the "raw" numbers and understand the events driving price fluctuations, merging technical and fundamental analysis in a single window.
High-Density Information
Designing data-heavy interfaces requires meticulous attention to typography, grids, and color coding. I focused on creating a visual hierarchy that highlights critical market changes while minimizing visual noise.
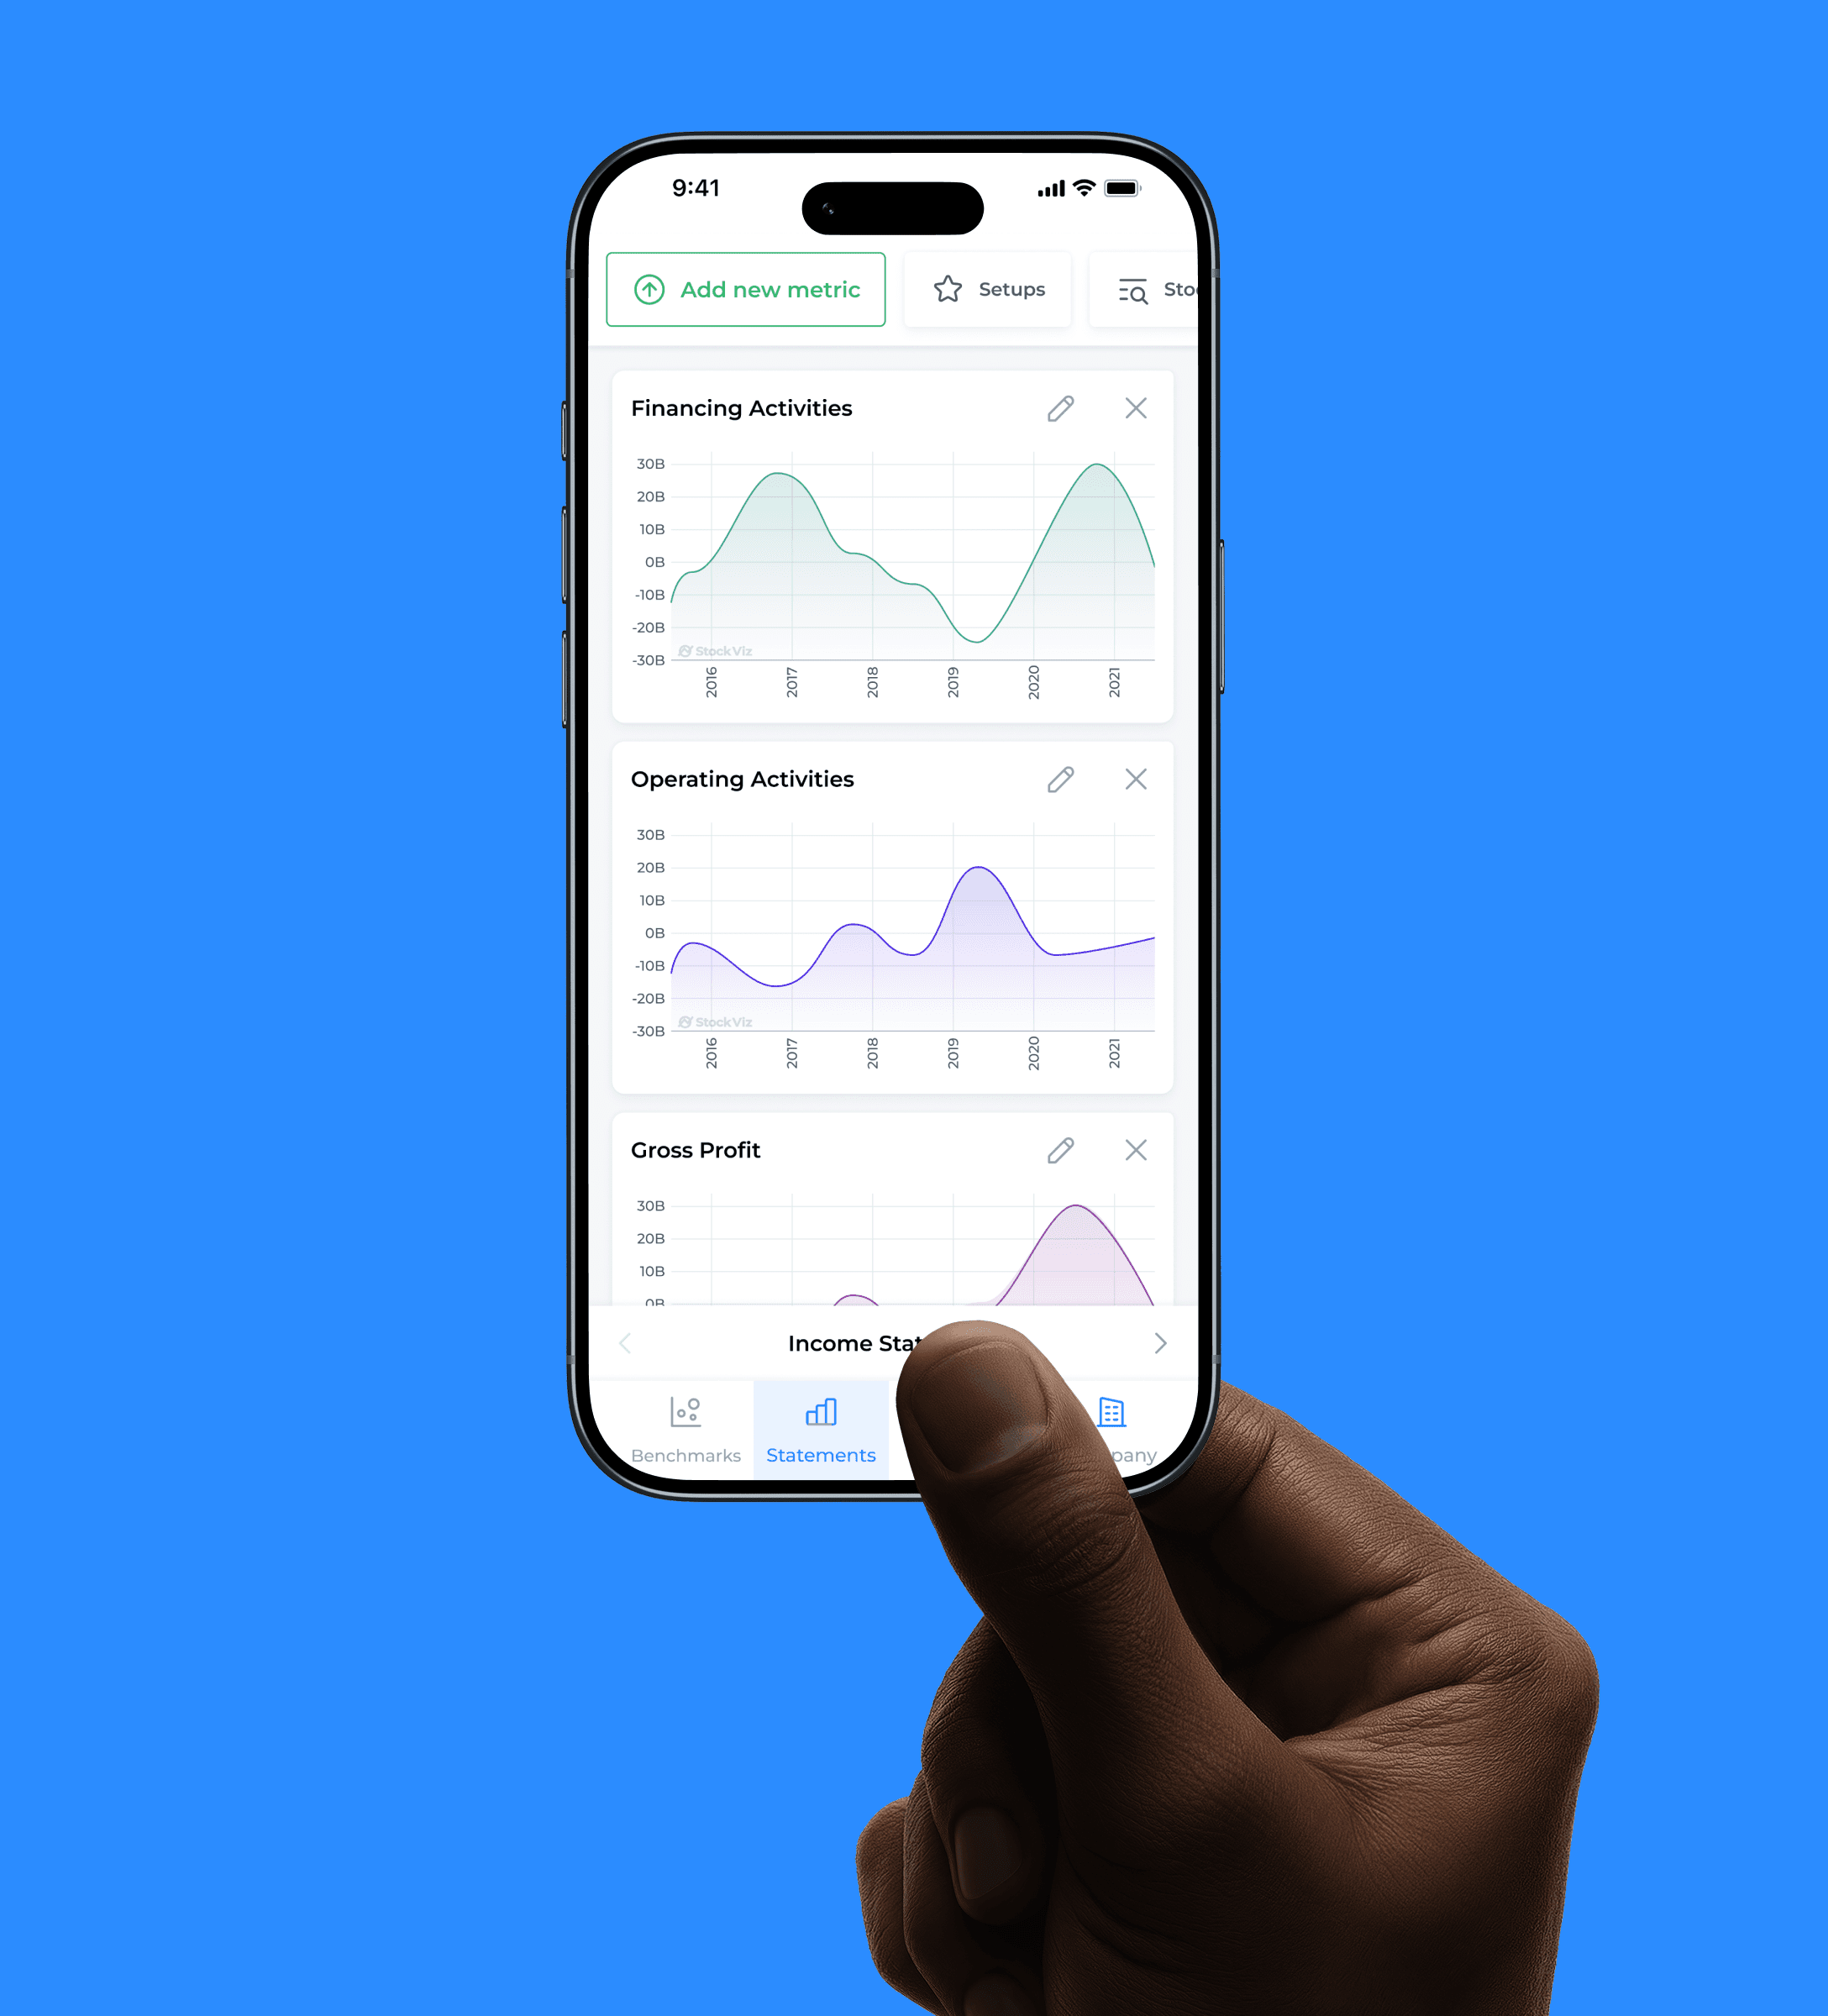
StockWiz has evolved into a comprehensive environment for stock market professionals. With streamlined navigation and quick access to sophisticated analytical tools, the platform helps users turn raw data into informed forecasts.
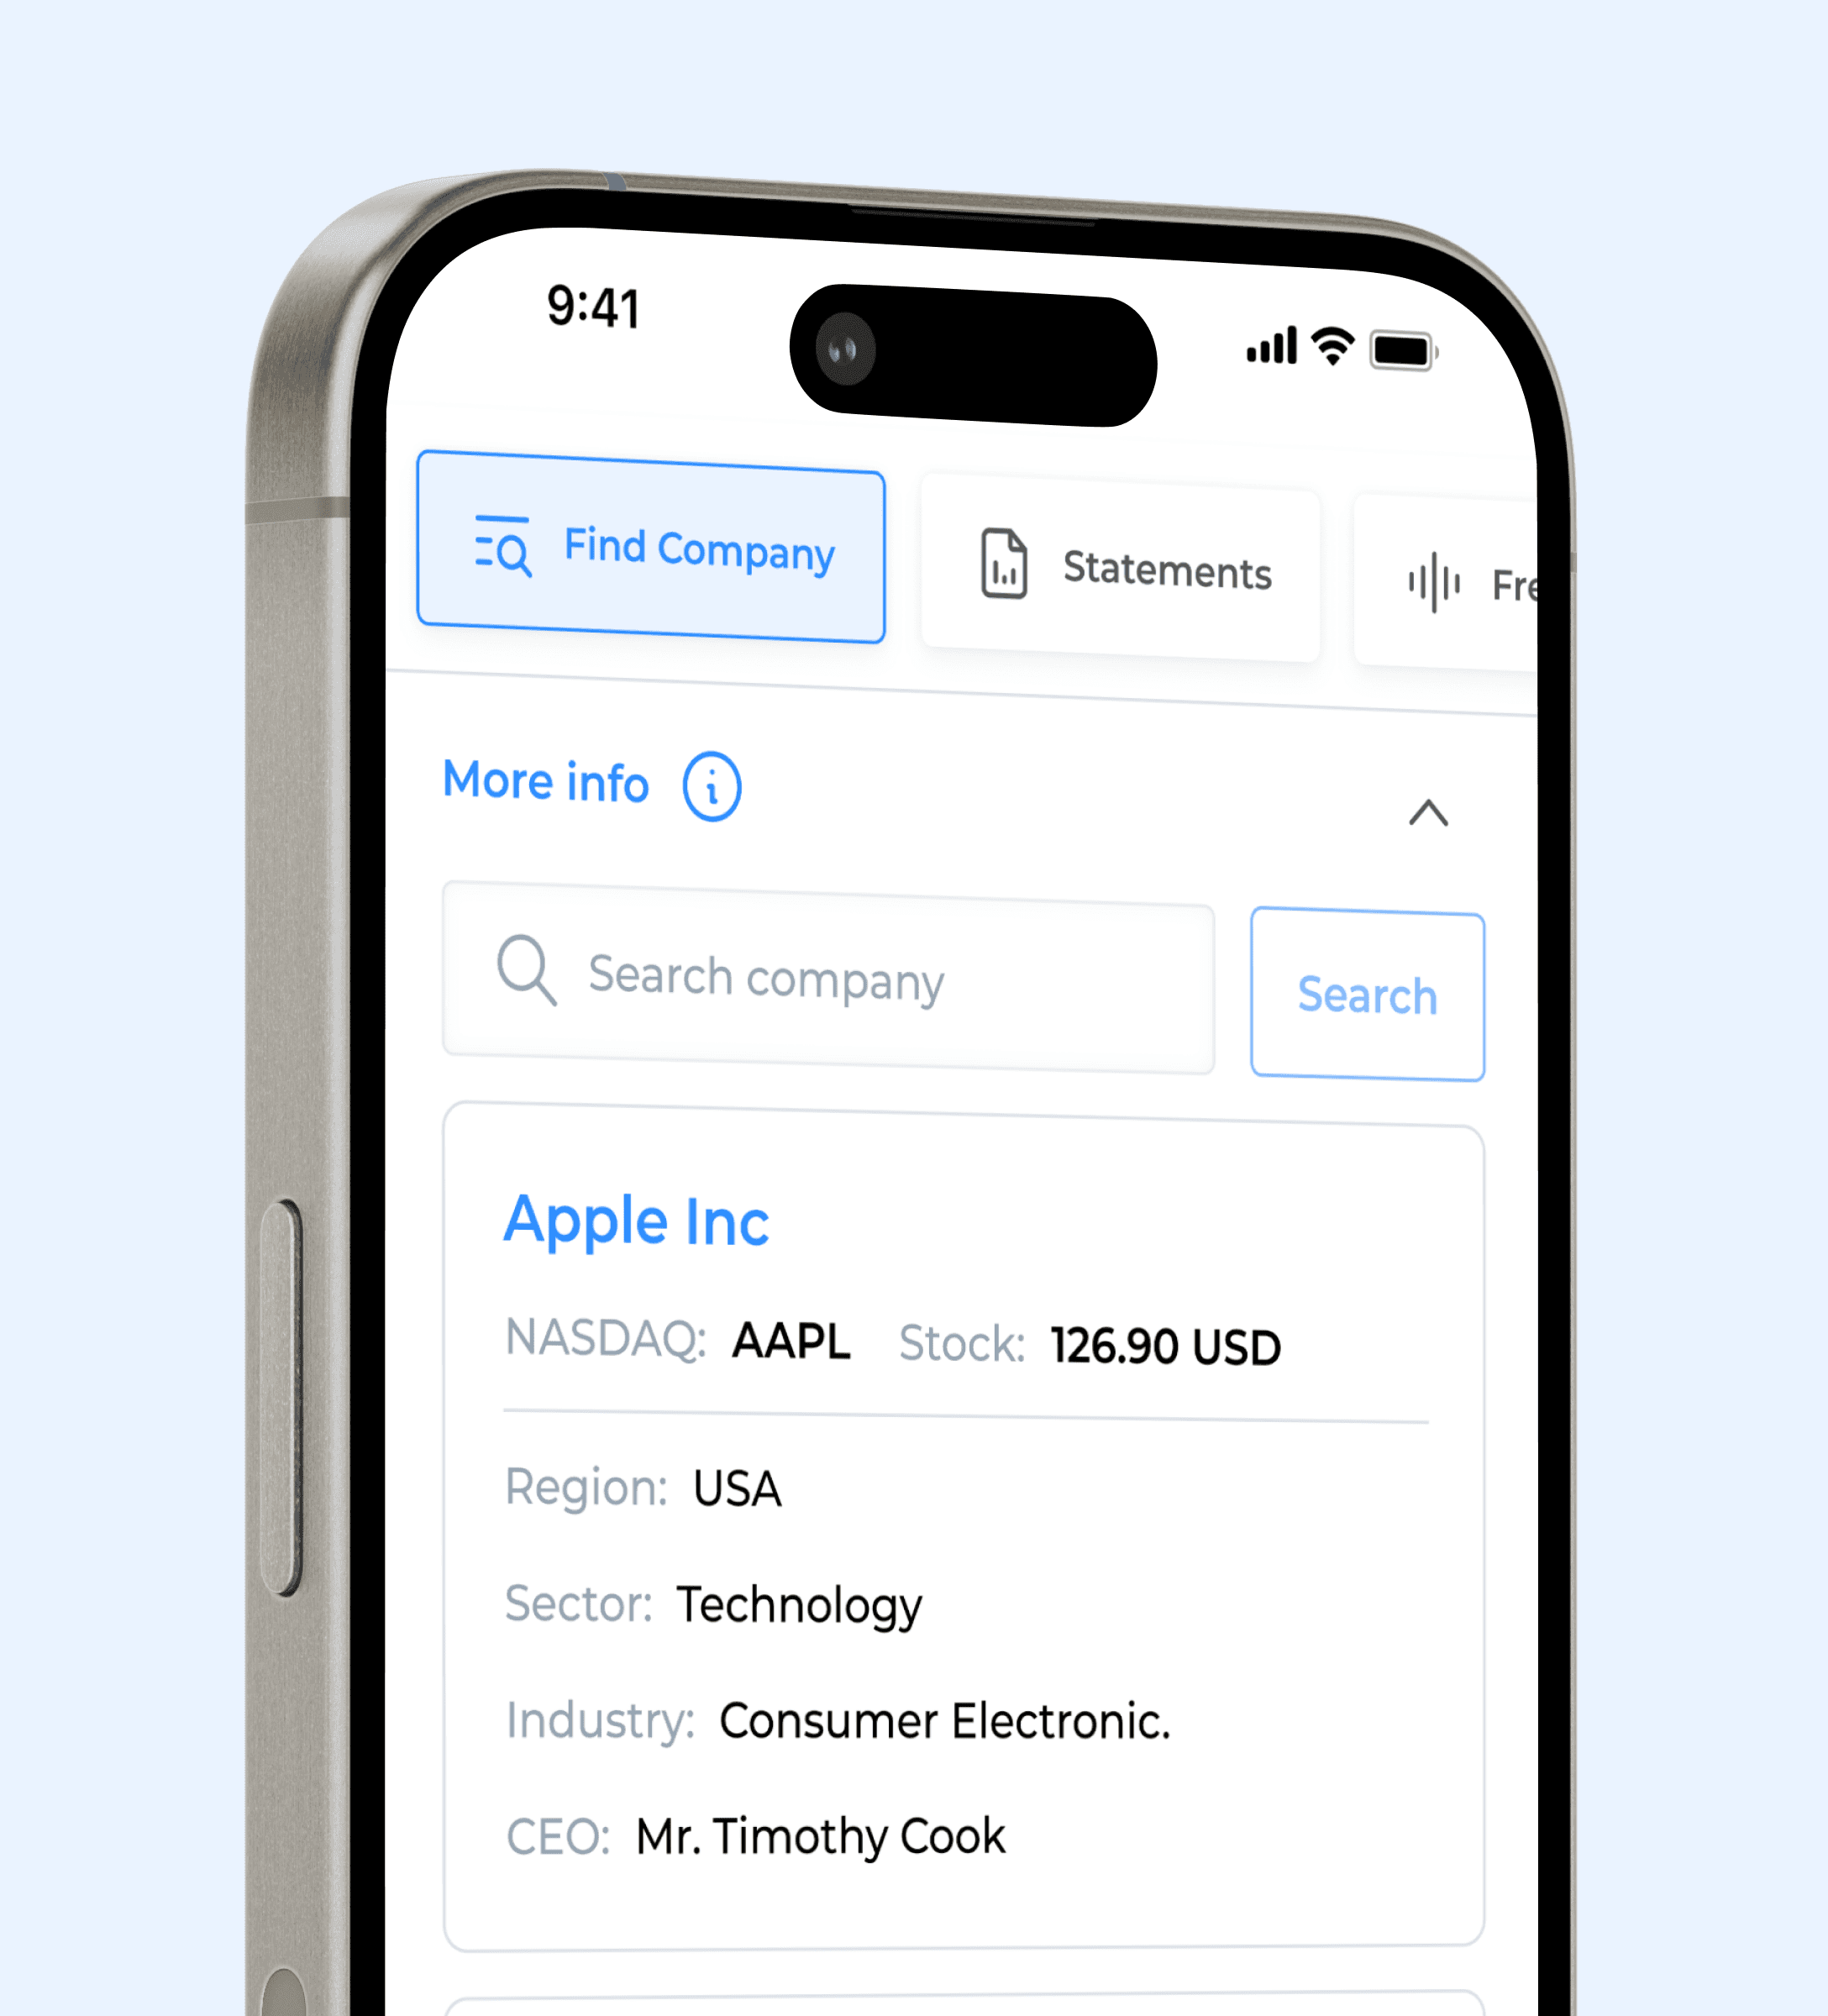
Recognizing that every analyst has a unique workflow, I implemented features for creating custom pivot tables and personalized view settings. This allows users to adapt their workspace to fit their specific needs and strategies.